[Online] Khóa Học Miễn Phí Về Bảng Điều Khiển Excel Trong Vòng Một Giờ
 ?NO DEADLINE
[English caption below]
?Mô tả
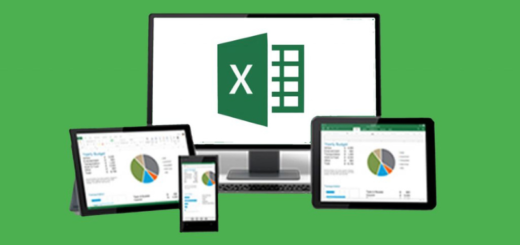
Bảng điều khiển Excel là một công cụ vô cùng hữu ích để tiếp cận và tóm tắt những dữ liệu Excel phức tạp. Nó được sử dụng để tóm tắt thông tin quan trọng và là một cách rất tốt để chia sẻ chế độ xem “ảnh chụp nhanh” giữa các nhóm.
- Nguyên tắc thiết kế và hiển thị
- Kiểm soát tương tác
- Tự động hóa bảng điều khiển của bạn để nó cập nhật trong vài giây
Khóa học sẽ đề cập đến cả những tính năng nâng cao của bảng điều khiển Excel, chẳng hạn như các nguyên tắc hiển thị và hình ảnh hóa để tạo ra bảng điều khiển một cách khoa học và rõ ràng, sử dụng các điều khiển tương tác để đảm bảo cho báo cáo có chứa nhiều thông tin và phù hợp. Chức năng phân tích và tự động hóa các thông tin cũng sẽ được đề cập để có một bảng điều khiển đầy đủ chức năng và hoàn chỉnh.
Sau khi hoàn thành, người học sẽ biết được thêm nhiều kỹ thuật và ví dụ để áp dụng cho tập dữ liệu của riêng họ, trong số một loạt các mẹo khác có thể được sử dụng trong công việc Excel hàng ngày.
? Yêu cầu
Khóa học này thực hành ở phiên bản Excel 2010 trở lên. Nó không thích hợp cho người dùng Mac. Tốt nhất là bạn nên làm quen với việc tạo biểu đồ cơ bản và PivotTable.
? Khóa học này dành cho ai
Khóa học này phù hợp với người dùng Excel đã có một số kinh nghiệm với biểu đồ và PivotTable nhưng cần phải ghép các phần lại với nhau để tạo báo cáo và bảng điều khiển Excel
? Bạn sẽ nhận được gì từ khóa học?
- Tạo được bảng điều khiển Excel sẽ tạo dấu ấn trước sếp và đồng nghiệp của bạn.
- Có thể xây dựng bảng điều khiển nhanh chóng và dễ cập nhật, thậm chí là nó có thể tự cập nhật (hãy tưởng tượng bạn có thể tự tin nói điều đó trong một cuộc phỏng vấn), chỉ bằng một cú nhấp chuột nếu bạn thiết lập nó đúng cách (khóa học sẽ chỉ cho bạn cách thực hiện) .
- Biết biểu đồ nào phù hợp với dữ liệu của bạn.
? Thông tin khóa học
- Online 100%
- Thời lượng: 58 phút
- Ngôn ngữ: Tiếng Anh
- Giảng viên: Mynda Treacy
- Nền tảng: Udemy
? Chi tiết đăng ký ngay tại: https://bit.ly/3BAYfQJ
—————————————————————
?Introduction
Excel Dashboards are a powerful tool to communicate and summarize complex Excel data. They can be created to summarize important information and are excellent for sharing a “snapshot” view among teams.
In this mini-course I’m going to teach you a handful of the most powerful techniques so you can get some fast results.
You too can master the creation of Interactive Excel Dashboards and learn to build Dashboard Reports from the ground up.
- Design and Display Principles
- Interactive Controls
- Automating your Dashboard so it updates in seconds
Impressive Content that Will Provide Insight, Analysis and Alerts Dashboards are fully interactive and dynamic and can help with project management, customer service, retail management, financial forecasting and much more.
Excel Dashboard students should have access to the PC version of Excel 2010 or later. Students should also be familiar with putting together any type of report in Excel to be able to apply the time saving and visualization techniques taught here. Students should be able to build and apply basic formulas in Excel. Pivot Table and Chart knowledge is helpful, but expertise is not necessary to take this course.
Contents and Overview This course includes 9 lectures and just over 1 hour of content in order to give students a working knowledge of utilizing Excel to create interactive Excel Dashboards to communicate their data.
Included are the Excel Dashboard workbook and PowerPoint presentation from the course which contain notes on where you can find more resources. You can use the workbook to practice what you learn and as a quick reference guide later on.
The course covers advanced features of Excel Dashboards, such as display and visualization principles for clear dashboard creation, using interactive controls to keep the report informative and relevant. Analyzing and automating information for a fully functional and complete dashboard.
Upon completion, students will have a variety of techniques and examples that can be applied to their own datasets, among a host of other tips that can be used in day to day Excel work.
? Requirements
This course is for Excel 2010 onward. It is not suitable for Mac users. Ideally you will be familiar with creating basic charts and PivotTables.
? Who this course is for
This course is ideal for the Excel user that has some experience with charts and PivotTables but is get to put the pieces together to make interactive Excel dashboards and reports.
? What will you learn from this course?
- Create Interactive Excel Dashboards that will wow your boss and colleagues.
- Be able to build Dashboards that are quick and easy to update, in fact they can update themselves (imagine being able to confidently say that in an interview), at the click of a button if you set them up right (I show you how).
- Know which chart to choose for your data.
? Course information
- Online 100%
- Time: 58m total length
- Language: English
- Instructor: Mynda Treacy
- Platform: Udemy
? Register now: https://bit.ly/3BAYfQJ
Các khóa học iVolunteer chia sẻ bao gồm 2 hình thức: miễn phí và trả phí. Các nền tảng cung cấp khóa học có thể thay đổi thành miễn phí - trả phí bất cứ lúc nào mà không cần báo trước. Để biết thêm chi tiết, bạn vui lòng truy cập tại link đính kèm trong bài đăng. Cảm ơn các bạn đã quan tâm!
Shortlink: https://ivolunteervietnam.com?p=28593
Trong quá trình tổng hợp và chia sẻ thông tin, các tình nguyện viên/ cộng tác viên/ thành viên rất khó tránh khỏi thiếu sót. Rất mong được độc giả cảm thông và góp ý tích cực để giúp iVolunteer Vietnam ngày một hoàn thiện & phát triển.
-
iVolunteer - Cơ hội tình nguyện cho sinh viên và giới trẻ Việt Nam
- Website: https://ivolunteervietnam.com/
- Email: connect@ivolunteer.vn
- Facebook: https://www.facebook.com/pg/iVolunteerVietnam
- Instagram: https://www.instagram.com/ivolunteervietnam
- Group: https://www.facebook.com/groups/thongtintinhnguyen
- Youtube: https://www.youtube.com/c/iVolunteerVietnam
- TikTok: https://www.tiktok.com/@ivolunteervietnam.com





 Bạn muốn bắt đầu một blog chuyên nghiệp nhưng lại không biết bắt đầu từ đâu?
  Bạn không biết cách sử dụng ngôn ngữ sao cho linh hoạt, tạo ra…

 Bạn đang gặp phải khó khăn khi có quá nhiều việc phải làm trong ngày nhưng bạn lại chưa sắp xếp thời gian hợp lý hoặc chưa thực sự…